- Research
- Open access
- Published:
Modeling fracture cementation processes in calcite limestone: a phase-field study
Geothermal Energy volume 6, Article number: 7 (2018)
Abstract
The present work investigates the influence of crack opening rates on the development of four important calcite vein morphologies, namely fibrous, elongate-blocky, partially open, and euhedral, as a result of bitaxial growth in syntaxial veins using a multiphase-field model. The continued fracturing that occurs during synkinematic cementation in these veins is simulated using the geometric shift algorithm. The stark resemblance of the numerically sealed vein microstructures with the natural samples in terms of structural characteristics as well as remaining pore space signifies a dominant role of crack opening rates in the resulting morphological patterns. Further, simulation results of slow crack opening rates reveal that non-uniform fibers of variable lengths are formed when initial crack aperture is small, due to suppression of growth competition and vice versa.
Background
Veins are ubiquitous geological structures in the earth’s crust and play a pivotal role in deciphering the deformation and fluid-flow histories of the rocks e.g., (Hilgers et al. 2006; Bons et al. 2012; McNamara et al. 2016). In open fractures with circulating formation fluids, when temperatures are sufficiently high and geochemical conditions [e.g., pCO2, pH, solution ionic composition, saturation state, reacting surface area, presence of inhibiting substances, and solution hydrodynamics (see Plummer et al. 1979; Herman and Lorah 1988; Girard et al. 1996; Gutjahr et al. 1996)] favor precipitation of minerals on the crack surface, syntaxial overgrowth cementation occurs. These fluids serve as the source of vein-filling mineral and are generally supersaturated with respect to the cement-forming solute (Bathurst 1972; Hilgers and Sindern 2005). A wide variety of crack-seal veins are formed due to different combinations of mineral type (e.g., quartz, calcite), growth directions (e.g., syntaxial, antitaxial), number of crack-seal events as well as fracture opening trajectories (e.g., fibrous, blocky, elongate-blocky), as reported in the literature (e.g., Durney and Ramsay 1973; Ramsay 1980; Cox and Etheridge 1983; Laubach 1988; Fisher and Brantley 1992; Hilgers and Urai 2002; Laubach et al. 2004a).
A deep understanding of crack opening rates, cement growth rates, and vein-forming mechanisms is highly relevant in the analysis of naturally fractured geothermal reservoirs (e.g., Dezayes et al. 2010; Haffen et al. 2013) as well as hydrocarbon exploration and production (e.g., Gale et al. 2004; Hilgers et al. 2006; Lamarche et al. 2012; Wuestefeld et al. 2016). The presence of open cracks enhances flow rates in geothermal projects and hydrocarbon reservoirs in otherwise impermeable formations. The natural fracture growth due to repeated fluid pressurization events (i.e., hydrofracturing) signifies a non-continuous and episodic crack opening that might grow rapidly over human time scales. However, recent petrographic investigations of the fractured sandstone in Cretaceous Travis Peak formation (Becker et al. 2010) reveal a prolonged fracture growth driven by gas generation, over a duration of 48 m.y. at the estimated crack opening rates of 16–23 μm/m.y.
Due to a large number of physical boundary conditions that are present in different geological settings, there exist several mechanisms that could lead to a specific vein texture. For instance, the early work of Taber (1918) proposed that fibrous veins are formed due to deposition of mineral in the wall rock-vein interface without any fracturing. This growth mechanism was termed as ‘antitaxial’ by Durney and Ramsay (1973), and was later numerically simulated by Urai et al. (1991) and Hilgers et al. (2001), and experimentally recreated by Means and Li (2001).
On the other hand, Mügge (1928) proposed that, for the fractures in their growth stage, if the cement growth rates are faster than the crack opening rates, the growth competition between neighboring crystals is suppressed and fibrous textures are formed. In general, the process of cement growth contemporaneous with fracture opening is known as synkinematic cementation (Laubach 1988). Therefore, any cement that has precipitated at the time of fracture opening, whether a crack-seal texture is present or not, is known as a synkinematic deposit. In nature, the sizes of incremental fracture opening can vary from few microns to few millimeters (Fisher and Brantley 1992). Accounts of accurate incremental opening sizes or so-called ‘gaps’ in the aforementioned range have been further reported in Laubach et al. (2004b) for quartz and in Hooker et al. (2012) for carbonate rocks. During synkinematic cementation, a complicated interplay of the continued crack opening and crystal growth occurs. This interplay determines the morphological attributes of the resulting veins based on the crack opening rates (Mügge 1928; Urai et al. 1991) and was shown to affect quartz-bearing veins (e.g., Laubach 1988; Lander and Laubach 2015), calcite veins (Hilgers et al. 2001), and carbonate veins in dolostones (Gale et al. 2010). Carbonate vein textures can also be subject to an interplay of syn- and postkinematic cementation (Ukar and Laubach 2016). The analysis of microtextures using e.g., a cathodoluminescence detector mounted on a scanning electron microscope (SEM-CL) might highlight the different cement generations (e.g., Ukar and Laubach 2016).
The natural samples of calcite veins derived from the Jurassic limestones of southern England exhibit four prominent morphologies, as depicted in Fig. 1a–d. Different crystallographic orientations of vein crystals are reflected by distinct interference colors. The fibrous veins (in Fig. 1a) are characterized by parallel grain boundaries occurring as thin fibers of different lengths and high length-to-width ratios. Figure 1b, c depicts the vein microstructures with elongate-blocky crystals manifesting crystallographic preferred orientations at the final growth stage, which indicates the presence of growth competition during vein formation. Elongate-blocky veins often exhibit partially open morphologies [one of the partially open morphologies is also called rind morphologies by Lander and Laubach (2015)]. Here, euhedral crystal faces border some porosity within the partially open fracture (Fig. 1c). Moreover, there exist veins that exhibit euhedral crystals (characterized by straight edges and sharp corners when visualized along thin-section) in contact with the pore space (black) in open fracture, as illustrated in Fig. 1d.

Natural samples of calcite veins in Jurassic limestones from southern England exhibiting a fibrous, b elongate-blocky, c partially open, and d euhedral morphologies. The wall rock in fibrous veins is not contained in the sample, but is located towards the base of the image in a. Different interference colors of vein crystals depict different crystallographic orientations. All images are obtained from transmitted microscopy and crossed polarizers
In this work, we utilize a multiphase-field model to delineate the underlying mechanisms behind the formation of the aforementioned calcite-vein textures based on the boundary conditions of synkinematic cementation in limestone. The phase-field method is a diffuse interface approach widely used for modeling microstructure evolution processes such as phase transitions, grain growth, among others (see review articles Boettinger et al. 2002; Moelans et al. 2008; Nestler and Choudhury 2011; Johannes et al. 2016). In contrast with the traditional front-tracking methods (see Urai et al. 1991; Bons 2001; Hilgers et al. 2001; Nollet et al. 2005), the phase-field approach does not require explicit tracking of the interfaces as the motion of interfaces is inherently captured in the governing equations. This property makes it a computationally efficient and robust approach for the treatment of moving boundary problems such as cement growth in open fractures or porous rocks, even in three dimensions (e.g., Ankit et al. 2013, 2015a, b; Wendler et al. 2016; Prajapati et al. 2017).
The present article is organized as follows: In "Methods" section, we describe the phase-field model, the numerical setup and the algorithm for the geometric shift condition. We then present the simulation results of bitaxial calcite cementation in fractures for different crack opening rates and highlight their implications on the resulting vein textures and the histories of fracture porosity in "Results and discussion" section. Further, the congruence of our numerically simulated vein textures with the natural samples is discussed. In "Conclusion and outlook" section, we conclude the article by recapitulating the important findings and propose directions for further studies.
Methods
Multiphase-field model
A thermodynamically consistent multiphase-field model Nestler et al. (2005) is employed to address the phenomenon of anisotropic crystal growth in calcite veins. The model has been previously applied to address the growth of minerals such as potash alum (Ankit et al. 2013), quartz (Ankit et al. 2013, 2015a, b; Wendler et al. 2016), and calcite (Prajapati et al. 2017). Therefore, for the sake of completeness, we briefly reiterate the model equations. For a detailed discussion and numerical implementation of equations and process-specific model extensions, the interested readers are referred to the above-mentioned articles.
We consider a vector of phase-field parameters \(\varvec{\phi }(\mathbf x , t)= [\phi _1 (\mathbf x , t), \ldots , \phi _N(\mathbf x , t)]\), where \(\phi _{\alpha }\in [0,1]~ \forall ~ \alpha \in \{1,\ldots , N \}\) describes the presence of each calcite grain \(\alpha \) at position \(\mathbf x \) and time t. The grain-grain or grain-liquid interface is characterized by a diffuse region of finite width. In the interface region shared between grain \(\alpha \) and liquid/other grains, the phase-field parameter \(\phi _{\alpha }\) varies smoothly from 0 outside, to 1 inside the grain. The location and shape of the grain are defined by the isoline with \(\phi _{\alpha }=0.5\). At each spatial point in the system with computational domain \(\Omega \), a summation constraint \(\sum _{\alpha =1}^N \phi _{\alpha }=1\) is satisfied. The total free energy of the system is formulated as
where \(\varepsilon \) represents a length scale parameter that controls the interfacial-width. \(\varepsilon a(\varvec{\phi }, \nabla \varvec{\phi })\), \(\dfrac{1}{\varepsilon } w(\varvec{\phi })\) , and \(f(\varvec{\phi })\) are the gradient energy density, the potential energy density, and the bulk free energy density of the system, respectively. The interface region is described by the gradient energy density, given by
where \(\gamma _{\alpha \beta }\) denotes the interfacial energy density between \(\alpha \) and \(\beta \) grains, and \(\mathbf q _{\alpha \beta }\)(\(=\phi _{\alpha }\nabla \phi _{\beta }-\phi _{\beta }\nabla \phi _{\alpha }\)) represents the generalized gradient vector pointing in the outward normal direction of the \(\alpha \)–\(\beta \) interface. The choice of function \(a_{\alpha \beta }(\varvec{\phi }, \nabla \varvec{\phi })\) determines the type of interface energy anisotropy (\(a_{\alpha \beta }=1\) for the isotropic case). Although, calcite exhibits a wide variety of growth habits including acute to obtuse rhombohedral, scalenohedral, prismatic, among several others, we limit the present discussion to a common rhombohedral calcite geometry (see Fig. 2a). In the present study, we assume that the crystal facets are developed due to strong faceted anisotropy in the interface energy. Therefore, a piece-wise function of the form
is utilized for incorporating such faceted anisotropy in the interface energy formulation. Here, \(\{\varvec{\eta }_{k,\alpha \beta } |~k=1,\ldots ,n_{\alpha \beta } \}\) denotes the position vectors corresponding to the \(n_{\alpha \beta }\) vertices of the Wulff shape of crystal \(\alpha \) dispersed in bulk phase \(\beta \). The evolution equations of the phase-fields read
for \(\alpha =1,\ldots ,N \).

a Symmetric and asymmetric projections of the rhombohedral calcite geometry. b Validation of interface energy anisotropy formulation corresponding to the asymmetric left-handed 2D projection. A spherical grain evolves to its equilibrium shape while retaining a constant volume. The final crystal shares a diffuse interface of finite width with the surrounding liquid. The shape and size of the crystal are defined by the isoline corresponding to \(\phi _{\text {grain}}=0.5\)
Here, \(\tau \) is the interfacial kinetic coefficient and \(\lambda \) is the Lagrange parameter to ensure the summation constraint \(\left( \sum _{\alpha =1}^{N}\phi _{\alpha }=1\right) \). The set of partial differential equations in Eq. (4) is solved using forward Euler scheme for time derivative and second-order accurate central difference scheme for the spatial derivatives. The numerical solution method is efficiently implemented in a parallel simulation framework for crystal evolution, PACE3D (see Hötzer et al. 2018), which is written in C language. The values of model parameters used in the present work are listed in Table 1.
Modeling calcite cements
The present work comprises a two-dimensional treatment of the complex process of synkinematic cementation with continuous fracture growth. Therefore, we obtain the following 2D projections: right-handed, symmetric and left-handed (see Fig. 2a), that were also highlighted in our previous article pertaining to three-dimensional modeling of cement overgrowth in porous limestones (Prajapati et al. 2017). During bitaxial cement growth in fractures, the effect of asymmetricity can be significant (Ankit et al. 2015b). Hence, we chose the left-handed projection of the calcite, in order to account for the influence of asymmetricity. The chosen position vectors for the vertices of crystal shape are as follows:
resulting in an aspect ratio of 1.33 of the 2D crystal. Figure 2b depicts the simulated left-handed 2D equilibrium shape of calcite from an initial spherical grain embedded in liquid phase, using the volume preservation technique (Nestler et al. 2008). For simulating bitaxial cement growth in progressive fracture-opening, the numerical setup is described in "Numerical setup" section.
Numerical setup
The initial grain structure in a 2D computational domain of dimensions \(1000 \Delta x \times 1000 \Delta x \) is generated using a voronoi diagram based on a random set of points, see Fig. 3a. The gray region below the lower crack surface is rendered stationary and is termed as barrier phase. In the very first step, a fracture of finite width is introduced resulting in two crack surfaces with randomly oriented grains as shown in Fig. 3b. The fracture is completely filled with liquid phase (in yellow), which is assumed to be supersaturated with respect to calcite. This assumption is realized by applying a constant driving force (\(f_{\alpha }\)) for the anisotropic crystal growth. In order to repress the influence of the opposing curvature-dependent forces on the crystal growth (see Plapp (2012) for fundamentals of phase-field), a sufficiently high value of \(f_{\alpha }~(=-\,0.15)\) is chosen for all the simulations. The defined boundary conditions for the numerical studies are shown in Fig. 3c. The geometric shift boundary condition applied at the lower crack surface is described in "Geometric shift condition" section. The definition of crystal orientations is depicted in Fig. 3d.

a Dimensions of the computational domain consisting of a layer of polycrystalline grains (in RGB colors) generated using voronoi diagram and the stationary barrier phase (in gray). b An initial crack filled with liquid (in yellow) is introduced. c The applied boundary condition at the edges of computational domain. d Definition of crystallographic orientation of calcite grains
Geometric shift condition
In order to simulate an opening crack, the previous unitaxial crack opening algorithm utilized by Ankit et al. (2013) was amended for bitaxial growth in syntaxial veins. The present so-called geometric shift algorithm relocates the entire set of grains on the lower surface by a given vertical displacement after a prescribed number of time steps and fills the new empty cells with liquid phase. This essentially implies that, in the scenario of crystal-bridging or vein closure, the crack always opens along the boundaries between the grains that lie on mutually opposite crack surfaces. Moreover, the phase-field evolution is not computed in the barrier phase, but the barrier is constantly consumed due to the shifting process.
Results and discussion
Effect of crack opening rate: implications for vein morphologies
By employing the generated computational domain with randomly oriented calcite seeds on the crack surfaces (in Fig. 3a), and the geometric shift condition for crack opening (described in "Geometric shift condition" section), simulations were performed for equal initial crack width and different values of crack opening rates, see Table 2 for parameters. Each simulation was performed until the barrier phase was completely consumed due to the moving lower crack surface along with the attached grains. In particular, three cases of slow, moderate, and fast opening rates were considered as follows:
-
Slow opening rate: For the applied driving force (\(f_{\alpha }= -\,0.15\)), the prescribed crack opening rate (in Table 2) is smaller than the minimum potential growth. For the chosen crack width of \(100 \Delta x\) (Fig. 4a), the magnitude of initial crack aperture is one order higher than the initial mean grain size of aggregates. This leads to a growth competition in the early stages as illustrated at \(t=1190\) in Fig. 4b. As soon as the crystals grow and fill the initial crack (at \(t=3850\) in Fig. 4b), further growth of crystals is almost completely dependent on the opening increments. From this stage onwards, the growth competition arising due to random grain orientations is suppressed. This implies that almost all grains grow equally into the fracture spaces introduced during small crack opening increments. Different stages of synkinematic cementation are shown in Fig. 4a, b. The resulting vein consists of fibrous crystals of nearly equal width and parallel to the crack opening displacements (at t = 59605 in Fig. 4b, e).
Fig. 4 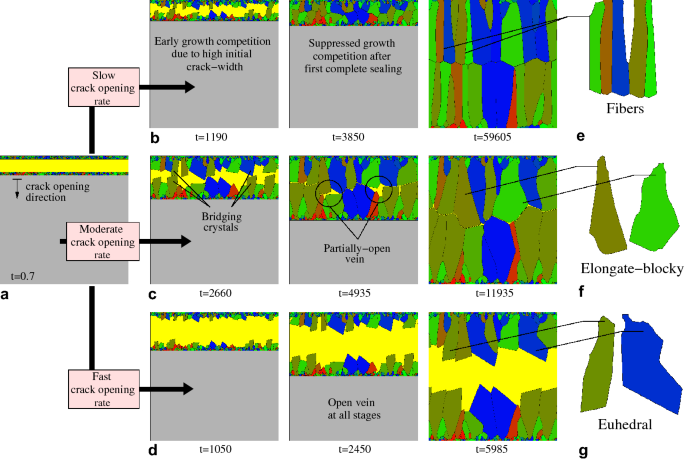
a Computational domain with an initial crack width of \(100 \Delta x\). Simulated bitaxial crystal growth for different values of crack opening rates: b Slow crack opening rate \(\Delta x / 1000 \Delta t\), c moderate crack opening rate \(\Delta x / 200 \Delta t,\) and d fast crack opening rate \(\Delta x / 100 \Delta t\). The progression is shown at representative simulation time steps. The selected crystals in the resulting vein morphologies are illustrated. e Fibers with almost equal width. f Elongate-blocky crystals with increasing width. g Crystals forming euhedral flat facets due to availability of sufficient pore space for crystal growth
-
Moderate opening rate: For the same driving force of grain growth as the previous case, the prescribed crack opening rate (in Table 2) lies between the maximum and minimum potential growth rate. Different stages of synkinematic cementation are shown in Fig. 4c. In the initial stages, due to the availability of sufficient pore space, the growth competition between the neighboring crystals of the same crack surface is dominant. It is noteworthy that since the aspect ratio of the chosen 2D equilibrium shape of calcite is close to unity, the orientation selection is more or less random. Therefore, the fastest growing crystals are decided on the basis of neighboring grain interactions. As the cementation progresses, the crystals begin to form bridges (at t = 2660 in Fig. 4c), so that the further growth is constrained by the crystals growing from the opposite crack surface resulting in partially open veins (at t = 4935 in Fig. 4c). At later stages, the pore space is entirely filled with bitaxial crystal growth leading to elongate-blocky vein textures with increasing width along the length of the crystals (at t = 11935 in Fig. 4c, f).
-
Fast opening rates: In this case, the crack opening rates are higher than the maximum potential growth rate. Under such conditions, the growth competition between the neighboring crystals is present and the growth is not constrained by the crystals growing from the opposite fracture surface. The veins are open at all stages of time and the resulting crystals are euhedral in nature with flat facets and sharp corners, as depicted at \(t=5985\) in Fig. 4d, g. The texture resembles rind morphologies described in Lander and Laubach (2015). In general, the aforementioned simulated results for calcite cement growth in fractures, depending upon fracture opening rate and crystal orientations are in good agreement with natural and experimental results, presented previously for quartz cements in fractures (Lander and Laubach 2015).

Effect of crack opening rate: implications on porosity evolution
The phase-field simulations (in "Effect of crack opening rate: implications for vein morphologies" section) provide valuable insights into the processes controlling the formation of fibrous, partially open, elongate-blocky, and euhedral veins based on the boundary conditions of synkinematic cementation. Apart from recreating the mechanisms behind various vein morphologies, the numerical simulations can provide information on histories of fracture porosity as a result of synkinematic cementation for different crack opening rates, see Fig. 5. The porosity-time behavior results from the interplay of crack opening rate and the anisotropic growth of crystals. For the present study, constant crack opening rates are applied for all cases, thereby implying a linear porosity-time behavior in the absence of anisotropic crystal growth (plotted in same colored dashed lines as the fracture sealing curves in Fig. 5). The anisotropic growth of crystals adds the non-linearity in the time evolution of porosity for the three crack opening rates (slow, moderate and fast). We analyze each case one by one as follows:
-
Slow opening rate (crack opening rate \(=~\Delta x / 1000 \Delta t\)): The porosity-time curve monotonically decreases with respect to time. Due to the early growth competition (described in "Effect of crack opening rate: implications for vein morphologies" section), the initial decline in the porosity is slow but accelerates as the cementation proceeds. After the first complete sealing (somewhere close to \(t=3850\) as shown in Fig. 4b), the crack reopening occurs along the interfaces between the crystals growing from opposite sides of the vein. The subsequent porosity evolution is completely dependent on the crack opening increment. The temporal evolution of porosity enters a periodic oscillatory regime due to the occurrence of alternate events of crack opening and vein filling, as illustrated in the zoomed inset picture of Fig. 5.
-
Moderate opening rate (crack opening rate \(=~\Delta x / 200 \Delta t\)): The porosity initially increases with time owing to the early growth competition (that suppresses crystal growth) and a higher opening rate. The growth competition declines due to occlusion of the growth of unfavorably oriented crystals, resulting in an increase in the net crystal growth rates. These increased growth rates lead to a maximum (at \(t=1225\)) followed by a monotonic decrease in the porosity-time curve. Due to the higher crack opening rate than the former case, the first complete sealing takes place at later stage in the present case.
-
Fast opening rate (crack opening rates \(=~\Delta x / 100 \Delta t\) and \(\Delta x / 50 \Delta t\)): The evolution of porosity monotonically increases with time. For even larger opening rates (i.e., \(\Delta x / 50 \Delta t\)), the porosity-time curve gets steeper. It is noteworthy that the porosity-time curve has an upper bound that is prescribed by the crack opening rates (dashed lines in Fig. 5). Therefore, although the porosity increases monotonically, the porosity-time curve is concave with respect to time.

Temporal evolution of fracture porosity for different crack opening rates represented by different colored solid lines. The same colored dashed lines depict the porosity-time behavior in the absence of cement growth, signifying constant crack opening rates. The inset picture illustrates the initial and final vein morphologies at the end of simulation
Effect of initial crack aperture
From the previous set of simulations (in "Effect of crack opening rate: Implications for vein morphologies" section), it is evident that the growth competition of different grain orientations is suppressed by the slow crack opening rates leading to fibrous morphologies. However, the early growth competition that arises due to the large initial crack aperture (one order higher than the grain size) results in the consumption of less favorably oriented grains in the initial stages. In this section, we investigate the influence of initial crack width on the resulting fibrous morphologies. In particular, we consider two cases of small and large initial cracks. The parameters used for the present study are listed in Table 3.
-
Small initial crack: In this case, the magnitude of initial crack width and grain size are of same order. Under such conditions, the growth competition is suppressed from the very beginning, leading to retardation in the occlusion of unfavorably oriented grains by the favorable ones. Therefore, more initial grains are preserved as shown at \(t=8400\) in Fig. 6a. As the cementation proceeds, the unfavorably oriented crystals are gradually occluded after the initial stages, resulting in arrested fibers of reduced length at intermediate time step (\(t=31150\) in Fig. 6a). The resulting veins (at \(t=66220\) in Fig. 6a) possess non-uniform fibrous textures consisting of fibers of different lengths.
-
Large initial crack: The magnitude of crack width is one order higher than that of grain size. Therefore, the intense initial growth competition (at \(t=1890\) in Fig. 6b) leads to occlusion of almost all the unfavorably oriented grains in the early stages. The fibers formed as a result of growth of favorably oriented crystals during the intermediate stages (at \(t=24535\) in Fig. 6b) exhibit very little growth competition. Therefore, the resulting veins (at \(t=59605\) in Fig. 6b) have uniform fibrous morphologies composed of almost all fully grown non-occluded fibers. In the following sections, we refer to these fibers as the ‘survivor’ fibers that have continued to grow from the crack surface to the center of the vein, without being occluded by the neighboring crystals.
We plot the temporal evolution of porosity along with the initial and final vein morphologies for the above cases in Fig. 7a. For a small initial crack width, the opening increments are of same order, forcing the cement growth to be entirely dependent on the crack opening. Therefore, the porosity evolution enters the periodic regime at an earlier stage than for the larger crack opening. As highlighted in Fig. 6, the simulated overgrowths for the two cases are compared at same vein-width (VW). In order to analyze the influence of initial growth competition, we plot the number of survivor grains with the evolving vein-width, see Fig. 7b.

Simulated bitaxial crystal growth for a initial crack width = \(5\Delta x\) (small crack) and b initial crack width = \(100\Delta x\) (large crack). Progression is shown at representative values of the evolving vein-width (VW). For small cracks, the resulting veins (at \(t=66220\) in a) consist of arrested as well as survivor fibers of different lengths, while large cracks lead to uniform fibrous vein textures (at \(t=59605\) in b)

a Temporal evolution of fracture porosity for different initial crack widths. The inset pictures illustrate the initial and final vein morphologies at the end of simulation. b Plot of the number of survivor grains with the evolving vein-width for different values of initial crack width
For a vein-width of \(200 \Delta x\), the number of survivor grains is lower for the large initial crack due to the suppression of growth of unfavorably oriented grains in the very beginning. The remaining grains grow with little competition; thereby, the decline in the number of survivor grains is lower as compared to the case of small initial crack. For the small initial crack, the unfavorably oriented grains are not occluded initially and are reduced gradually over the entire process of cementation. It is noteworthy that the resulting number of survivor fibers is similar in both cases. Present simulations provide valuable insights into the growth dynamics of arrested and survivor fibers. We infer that natural samples of non-uniform fibrous veins exhibiting arrested and survivor fibers result due to slow opening rates and small crack apertures at all stages of synkinematic cementation. On the other hand, uniformly long fibers in the fibrous veins indicate the presence of large crack apertures at the initial stages of synkinematic cementation, leading to the occlusion of unfavorably oriented crystals in the very beginning.
Comparison with natural samples
Natural samples of calcite veins showcase a wide variety of vein cement morphologies, which can be linked to the simulation results. All shown samples were observed in Jurassic limestones from southern England (Blue Lias at Kilve and Lyme Regis, hand specimens were collected from loose boulders at the beaches). Euhedral vein-forming crystals, characterized by straight edges in contact with open pore space (black in Fig. 8a), are in good agreement with simulated examples, highlighting growth competition at the contact with the host rock and increasing crystal width towards the pore (Fig. 8a). Pore morphologies and occasional irregular domain contacts between bitaxially grown calcite vein cements in partially open veins show a good match between natural and simulated examples (Fig. 8b). This includes the possibility of euhedral crystal facets in small open pores. The elongate-blocky morphology of moderate crack opening rates, resulting in a mostly sealed vein is characterized by irregular contacts between domains grown from opposing sides of the crack (Fig. 8c). This also includes growth competition at the host rock interface of the fracture. The case of slow crack opening rate and small initial crack aperture resulting in non-uniform fibrous calcite cement of varying length matches well with habits observed in natural fibrous veins (Fig. 8d).

Comparison of simulated vein morphologies with natural samples. The sketches of natural samples (in gray scale) are drawn from the natural samples of calcite veins in Jurassic limestones from southern England, shown in Fig. 1. a Euhedral, b partially open, c elongate-blocky and d fibrous veins. The wall rock (gray) in the sketch of fibrous vein is not contained in the sample, but it is towards the base of the image. The simulated veins exhibit strong resemblance with the natural samples suggesting a pronounced role of crack opening rates and initial crack width in the formation of different vein textures
Conclusion and outlook
While the recent numerical works (e.g., Ankit et al. 2015a, b; Wendler et al. 2016) advocate the potential of the phase-field approach in addressing quartz mineral growth in sandstones, the present study in addition to our previous work (Prajapati et al. 2017) serves as a basis for new calcite cementation models for carbonate rocks based on sound thermodynamic principles. The present study complements the works of Bons (2001) and Hilgers et al. (2001) (who used front-tracking technique) and adds to them. While the vein morphologies arising due to the interplay of different crack opening rates and cement growth rates are faithfully reproduced by the phase-field simulations, the present study additionally highlights the formation mechanisms of uniform and non-uniform fibrous veins based on the initial crack apertures. The convincing resemblance between the numerically sealed vein morphologies with natural samples further demonstrates the capabilities of the employed multiphase-field model in elucidating the growth dynamics of four prominent calcite-vein textures (fibrous, elongate-blocky, partially open, and euhedral). Furthermore, the model in conjunction with innovative pre- and post-processing tools developed for the analysis and visualization of numerical data allows to speculate the reduction of fracture porosity over time.
Although the present study is limited to 2D, the implementation of the model in 3D is fairly straight forward, albeit with increased computational resources. This provides a distinct edge over the conventional front-tracking methods that are restricted to 2D owing to numerical issues that arise while addressing the process in three dimensions. Although bitaxial crack-seal mechanism is by far the most common vein-forming process, nevertheless, very few numerical studies have hitherto been conducted, due to the aforementioned reasons. The extension of the present work to three dimensions remains an interesting prospect for future studies that enables the analyses of the fracture networks and flow behavior in the geothermal reservoir rocks. The present work assumes a constant crack opening and models fracturing as a continuous process. However, the implemented geometric shift condition can directly be utilized to simulate episodic reopening of fractures (orthogonal to the crack surface) in response to repeated pressurization events, i.e., hydrofracturing. The present work paves the way for the ongoing studies that explore the development of syntaxial textures due to complex fracture opening histories and paths such as crack opening obliquely to the vein boundaries or along curved trajectories. Moreover, building upon the previous works of (Ankit et al. 2013, b), the model along with appropriate extensions can be utilized to further explore the controls on the formation of antitaxial and ataxial veins. The present work is an initial treatment of a highly coupled thermo-hydro-mechanical-chemical problem of vein formation as a result of cementation, wherein faceted crystal growth mechanisms based on the boundary conditions of synkinematic cementation are simulated. The present phase-field model needs to be extended in order to account for the mechanical forces for crack opening and chemical driving forces for crystal growth that facilitates the differential growth rates on facetted and unfacetted surfaces as suggested by Ukar and Laubach (2016). Provided the availability of physical parameters (e.g., crystal orientations, supersaturation of solute, absolute rates of calcite accumulation) through benchmark cement growth experiments, the model can be calibrated to precisely mimic the experimentally synthesized veins and further explore the controls on fabric development in natural veins.
References
Ankit K, Nestler B, Selzer M, Reichardt M. Phase-field study of grain boundary tracking behavior in crack-seal microstructures. Contrib Miner Petrol. 2013;166(6):1709–23.
Ankit K, Selzer M, Hilgers C, Nestler B. Phase-field modeling of fracture cementation processes in 3-D. J Petrol Sci Res. 2015;4(2):79–96.
Ankit K, Urai JL, Nestler B. Microstructural evolution in bitaxial crack-seal veins: a phase-field study. J Geophys Res. 2015;120(5):3096–118.
Bathurst RG. Carbonate sediments and their diagenesis, vol. 12. Amsterdam: Elsevier; 1972.
Becker SP, Eichhubl P, Laubach SE, Reed RM, Lander RH, Bodnar RJ. A 48 my history of fracture opening, temperature, and fluid pressure: Cretaceous Travis Peak Formation. East Texas basin. Bulletin. 2010;122(7–8):1081–93.
Boettinger WJ, Warren JA, Beckermann C, Karma A. Phase-field simulation of solidification. Ann Rev Mater Res. 2002;32(1):163–94.
Bons PD. Development of crystal morphology during unitaxial growth in a progressively widening vein: I. The numerical model. J Struct Geol. 2001;23(6–7):865–72.
Bons PD, Elburg MA, Gomez-Rivas E. A review of the formation of tectonic veins and their microstructures. J Struct Geol. 2012;43:33–62.
Cox SF, Etheridge MA. Crack-seal fibre growth mechanisms and their significance in the development of oriented layer silicate microstructures. Tectonophysics. 1983;92(1–3):147–70.
Dezayes C, Genter A, Valley B. Structure of the low permeable naturally fractured geothermal reservoir at Soultz. Comptes Rendus Geosci. 2010;342(7–8):517–30.
Durney D, Ramsay JG. Incremental strains measured by syntectonic crystal growths. In: De Jong KA, Scholten R, editors. Gravity and tectonics. New York: Wiley; 1973. p. 67–96.
Fisher DM, Brantley SL. Models of quartz overgrowth and vein formation: deformation and episodic fluid flow in an ancient subduction zone. J Geophys Res. 1992;97(B13):20043–61.
Gale JF, Laubach SE, Marrett RA, Olson JE, Holder J, Reed RM. Predicting and characterizing fractures in dolostone reservoirs: using the link between diagenesis and fracturing. Geol Soc Lond. 2004;235(1):177–92.
Gale JF, Lander RH, Reed RM, Laubach SE. Modeling fracture porosity evolution in dolostone. J Struct Geol. 2010;32(9):1201–11.
Girard JP, Sanjuan B, Czernichowski-Lauriol I, Fouillac C. Diagenesis of the Oseberg Sandstone Reservoir (North Sea): an example of integration of core, formation fluid and geochemical modelling studies. AAPG Bulletin. 5(CONF-960527). 1996.
Gutjahr A, Dabringhaus H, Lacmann R. Studies of the growth and dissolution kinetics of the CaCO3 polymorphs calcite and aragonite II. The influence of divalent cation additives on the growth and dissolution rates. J Cryst Growth. 1996;158(3):310–5.
Haffen S, Géraud Y, Diraison M, Dezayes C. Fluid-flow zones in a geothermal sandstone reservoir: localization from thermal conductivity and temperature logs, borehole EPS1(Soultz-sous-Forêts, France). Geothermics. 2013;46:32–41.
Herman JS, Lorah MM. Calcite precipitation rates in the field: measurement and prediction for a travertine-depositing stream. Geochimica et Cosmochimica Acta. 1988;52(10):2347–55.
Hilgers C, Koehn D, Bons PD, Urai JL. Development of crystal morphology during unitaxial growth in a progressively widening vein: II. Numerical simulations of the evolution of antitaxial fibrous veins. J Struct Geol. 2001;23(6–7):873–85.
Hilgers C, Sindern S. Textural and isotopic evidence on the fluid source and transport mechanism of antitaxial fibrous microstructures from the Alps and the Appalachians. Geofluids. 2005;5(4):239–50.
Hilgers C, Urai JL. Microstructural observations on natural syntectonic fibrous veins: implications for the growth process. Tectonophysics. 2002;352(3–4):257–74.
Hilgers C, Nollet S, Schonherr J, Urai JL. Paleo-overpressure formation and dissipation in reservoir rocks. Oil Gas Eur Mag. 2006;32(2):68–73.
Hilgers C, Kirschner DL, Breton JP, Urai JL. Fracture sealing and fluid overpressures in limestones of the Jabal Akhdar dome. Oman mountains. Geofluids. 2006;6(2):168–84.
Hooker JN, Gomez LA, Laubach SE, Gale JFW, Marrett R. Effects of diagenesis (cement precipitation) during fracture opening on fracture aperture-size scaling in carbonate rocks. Geol Soc Lond. 2012;370(1):187–206.
Hötzer J, Reiter A, Hierl H, Steinmetz P, Selzer M, Nestler B. The parallel multi-physics phase-field framework Pace3D. J Comput Sci. 2018;26:1–12.
Johannes H, Michael K, Philipp S, Britta N. Applications of the phase-field method for the solidification of microstructures in multi-component systems. J Indian Inst Sci. 2016;96(3):235–56.
Lamarche J, Lavenu AP, Gauthier BD, Guglielmi Y, Jayet O. Relationships between fracture patterns, geodynamics and mechanical stratigraphy in Carbonates (South-East Basin, France). Tectonophysics. 2012;581:231–45.
Lander RH, Laubach SE. Insights into rates of fracture growth and sealing from a model for quartz cementation in fractured sandstones. GSA Bull. 2015;127(3–4):516–38.
Laubach SE. Subsurface fractures and their relationship to stress history in East Texas Basin sandstone. Tectonophysics. 1988;156(1–2):37–49.
Laubach SE, Reed RM, Olson JE, Lander RH, Bonnell LM. Coevolution of crack-seal texture and fracture porosity in sedimentary rocks: cathodoluminescence observations of regional fractures. J Struct Geol. 2004;26(5):967–82.
Laubach SE, Lander RH, Bonnell LM, Olson JE, Reed RM. Opening histories of fractures in sandstone. Geol Soc Lond. 2004;231(1):1–9.
McNamara DD, Lister A, Prior DJ. Calcite sealing in a fractured geothermal reservoir: insights from combined EBSD and chemistry mapping. J Volcanol Geotherm Res. 2016;323:38–52.
Means WD, Li T. A laboratory simulation of fibrous veins: some first observations. J Struct Geol. 2001;23(6–7):857–63.
Moelans N, Blanpain B, Wollants P. An introduction to phase-field modeling of microstructure evolution. Calphad. 2008;32(2):268–94.
Mügge O. Ueber die Entstehung faseriger Minerale und ihrer Aggregationsformen. Neues Jahrbuch für Mineralogie, Geologie und Paläontologie A. 1928;58:303–438.
Nestler B, Choudhury A. Phase-field modeling of multi-component systems. Curr Opin Solid State Mater Sci. 2011;15(3):93–105.
Nestler B, Garcke H, Stinner B. Multicomponent alloy solidification: phase-field modeling and simulations. Phys Rev E. 2005;71(4):041609.
Nestler B, Wendler F, Selzer M, Stinner B, Garcke H. Phase-field model for multiphase systems with preserved volume fractions. Phys Rev E. 2008;78(1):011604.
Nollet S, Urai JL, Bons PD, Hilgers C. Numerical simulations of polycrystal growth in veins. J Struct Geol. 2005;27(2):217–30.
Plapp Mathis. Phase-field models. Multiphase microfluidics: the diffuse interface model. Vienna: Springer; 2012. p. 129–75.
Plummer LN, Parkhurst DL, Wigley TML. Critical review of the kinetics of calcite dissolution and precipitation. In: Jenne E. Chemical modeling in aqueous systems; ACS Symposium Series. 1979, p. 537-73.
Prajapati N, Selzer M, Nestler B. Computational modeling of calcite cementation in saline limestone aquifers: a phase-field study. Geotherm Energy. 2017;5(1):15.
Ramsay JG. The crack-seal mechanism of rock deformation. Nature. 1980;284:135–9.
Taber S. The origin of veinlets in the Silurian and Devonian strata of central New York. J Geol. 1918;26(1):56–73.
Ukar E, Laubach SE. Syn-and postkinematic cement textures in fractured carbonate rocks: insights from advanced cathodoluminescence imaging. Tectonophysics. 2016;690:190–205.
Urai JL, Williams PF, Van Roermund HLM. Kinematics of crystal growth in syntectonic fibrous veins. J Struct Geol. 1991;13(7):823–36.
Wendler F, Okamoto A, Blum P. Phase-field modeling of epitaxial growth of polycrystalline quartz veins in hydrothermal experiments. Geofluids. 2016;16(2):211–30.
Wuestefeld P, De Medeiros M, Koehrer B, Sibbing D, Kobbelt L, Hilgers C. Automated workflow to derive LIDAR fracture statistics for the DFN modelling of a tight gas sandstone reservoir analog. In: 78th EAGE Conference and Exhibition 2016; 2016.
Authors' contributions
NP conducted the numerical studies under the supervision of MS in addition to conceptual discussions with BN, BB, and CH. MS and NP implemented the geometric shift algorithm for the present study. BB and CH provided the microphotographs of the natural samples. NP drafted the manuscript. All authors edited the manuscript. All authors read and approved the final manuscript.
Acknowledgements
The authors would like to thank the Helmholtz Association for the financial support through “KIT-Integration initiative in geothermal systems” and within the program “RE-renewable energies.” Further, we acknowledge publication support by Helmholtz Centre for Environmental Research—UFZ; Helmholtz Centre Potsdam—GFZ German Research Centre for Geosciences; and Karlsruhe Institute of Technology for the article processing charges.
Competing interests
The authors declare that they have no competing interests.
Availability of data and materials
All relevant data and material are presented in the paper.
Consent for publication
Not applicable.
Ethics approval and consent to participate
Not applicable.
Publisher’s Note
Springer Nature remains neutral with regard to jurisdictional claims in published maps and institutional affiliations.
Author information
Authors and Affiliations
Corresponding author
Rights and permissions
Open Access This article is distributed under the terms of the Creative Commons Attribution 4.0 International License (http://creativecommons.org/licenses/by/4.0/), which permits unrestricted use, distribution, and reproduction in any medium, provided you give appropriate credit to the original author(s) and the source, provide a link to the Creative Commons license, and indicate if changes were made.
About this article

Cite this article
Prajapati, N., Selzer, M., Nestler, B. et al. Modeling fracture cementation processes in calcite limestone: a phase-field study. Geotherm Energy 6, 7 (2018). https://doi.org/10.1186/s40517-018-0093-4
Received:
Accepted:
Published:
DOI: https://doi.org/10.1186/s40517-018-0093-4